Visual Lint static C++ code analysis adapter for Visual Studio

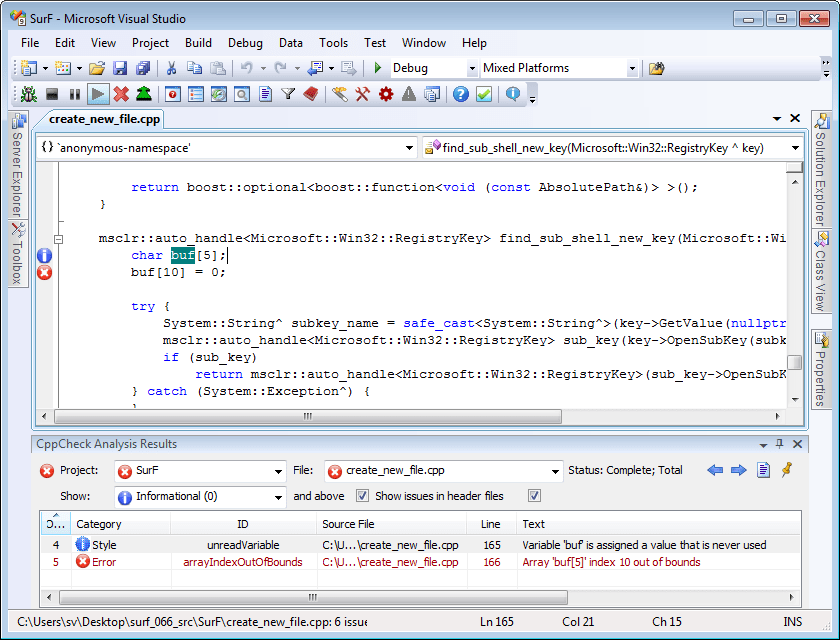
Visual Lint by Riverblade integrates most popular static C++ code analysis tools with Visual Studio. It supports Gimpel PC-lint, CppCheck, Google cpplint.py and Inspirel Vera++. Visual Lint lets you run these tools from Visual Studio with a single click for a selected file or a solution and displays analysis results in the Visual Studio editor or a tool window:

Visual Lint shows CppCheck analysis results in Visual Studio 2008

Visual Lint shows CppCheck analysis results in Visual Studio 2008


After you update and save a file, Visual Lint automatically runs an analysis on it in background and almost immediately shows any violations in the gutter. You can select which issues you want to see by type and by id. A summarizing HTML report is available, but with an established process number of issues should be zero.

Visual Lint doesn’t do any code analysis itself. It passes information about your Visual Studio project to the selected external analysis tool, parses analysis results and displays them in the most convenient way in Visual Studio. One limitation is that Visual Lint can’t run all configured tools at once to cover all kinds of issues; you need to manually switch between CppCheck, cpplint etc:

Analysis tool selection

Analysis tool selection


CppCheck mostly checks correctness of code, PC-lint checks both correctness and style, cpplint and Vera++ verify formatting, helping you conform to your company’s coding standard:
Vera++ formatting analysis results

Vera++ formatting analysis results


cpplint formatting analysis results

cpplint formatting analysis results


Particularly for formatting issues, it is very important that all tools allow creation of custom rules, tailoring to your specific needs.

Visual Lint also support C# code analysis via FxCop and Java analysis via FindBugs. All Visual Studio versions from VC 6 to VS 2010 are supported. A single user Standard Edition license costs $199 USD, but most useful features like code editor markers, multiple tools support and issues filters are only available in the Enterprise Edition that costs $799. You can download a 30-day trial version from the official site.


Organize Visual Studio tabs with Tabs Studio add-in

Posted in Reviews | Tagged , , , | 2 Comments

Favorite Documents v1.5 released

Favorite Documents is a free extension that lets you create links to frequently used code files and then quickly open them as a group or individually from the Favorites menu in Visual Studio 2010/11.

Favorite Documents v1.5 adds the abilities to create links to folders in Source Control Explorer and favorite documents from the Solution Explorer context menu.

Download the installer.

Posted in Vlasov Studio tools | Tagged , , | Leave a comment

VSColorOutput extension for Visual Studio 2010 and Visual Studio 11

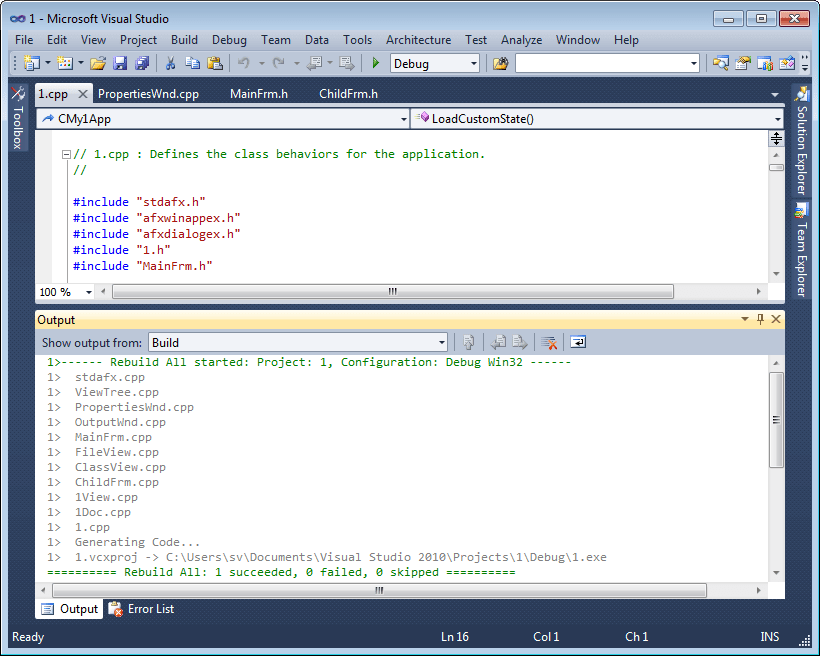
VSColorOutput by Blue Onion Software simplifies large logs analysis in the Visual Studio Output window coloring important lines:

Colored build results in the Output window in Visual Studio 2010

Colored build results in the Output window in Visual Studio 2010


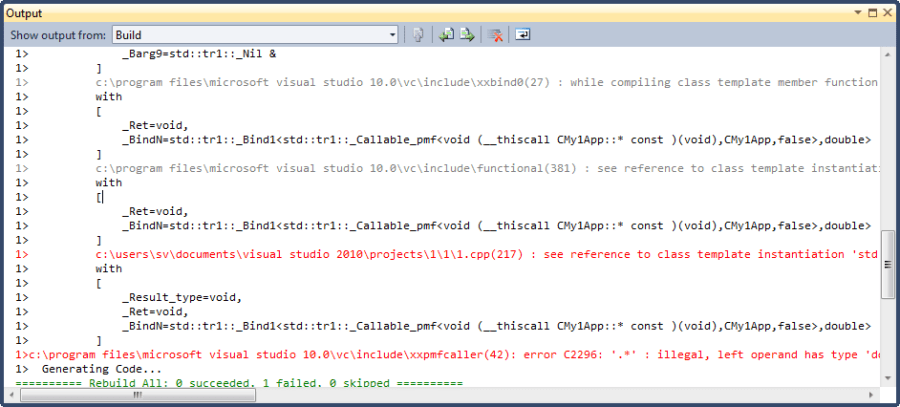
For example, C++ developers often need to look at the output to find the origin of an error that involves several template instantiations:
Template instantiations log

Template instantiations log


In practice, the most important line in this log includes a reference to a file in the current solution. With VSColorOutput it is easy to highlight lines with references to files in the solution and downplay lines with references to standard include files:
Colored template instantiations log

Colored template instantiations log


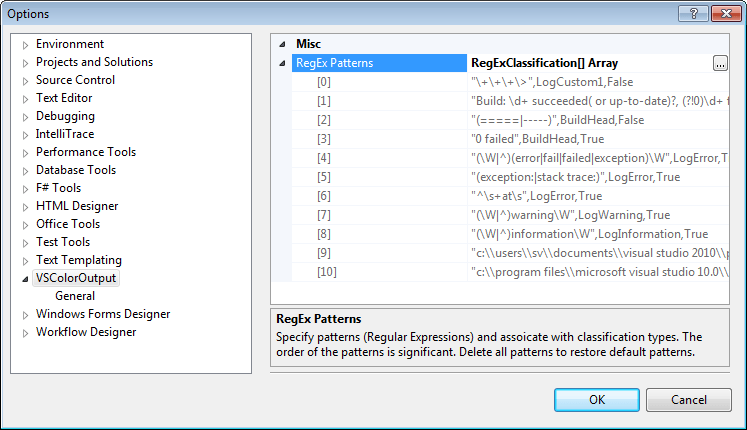
You can classify output lines for your needs using .NET regular expressions. To open the RegExClassification Collection Editor dialog go to ToolsOptionsVSColorOutput:
VSColorOutput settings in the Visual Studio Options dialog

VSColorOutput settings in the Visual Studio Options dialog


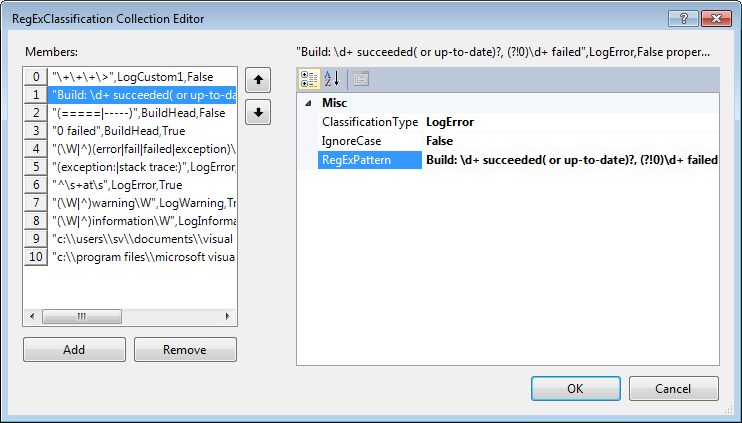
For example, to color build results red when build fails, you can use the following regex “Build: \d+ succeeded( or up-to-date)?, (?!0)\d+ failed” with the classification type LogError and position this member before the “(=====|—–),BuildHead” member as the first member match wins:
RegExClassification Collection Editor

RegExClassification Collection Editor


Red build results on a build error

Red build results on a build error


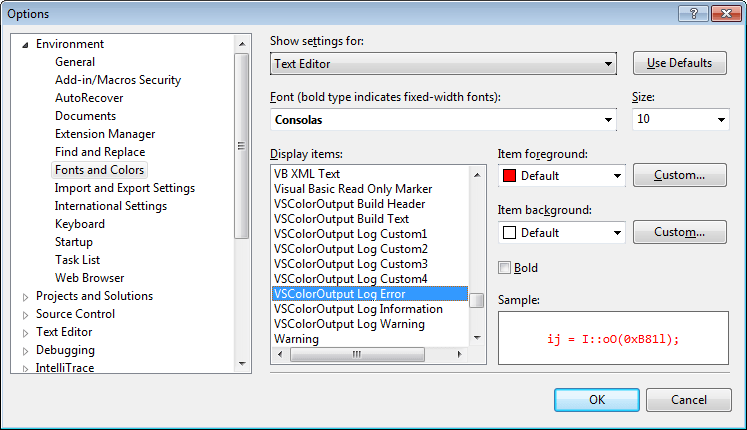
Note that after modifying classification rules you need to regenerate output (e.g. rebuild) to see the changes. You can customize colors for each output line type going to ToolsOptionsEnvironmentFonts and Colors:
Color settings for different output line types

Color settings for different output line types


VSColorOutput colors trace messages in the Output window during debugging as well. Actually, this was author’s original idea for the extension:
Coloring trace messages during a debug session

Coloring trace messages during a debug session


VSColorOutput also supports Visual Studio 11 Developer Preview:
Colored build results in the Output window in Visual Studio 11

Colored build results in the Output window in Visual Studio 11


You can download the free VSColorOutput extension for Visual Studio 2010 and Visual Studio 11 from Visual Studio Gallery. You can get source code for the extension from Codeplex.


Organize Visual Studio tabs with Tabs Studio add-in

Posted in Reviews | Tagged , , | 2 Comments

Code Jumper extension for Visual Studio 2010 review

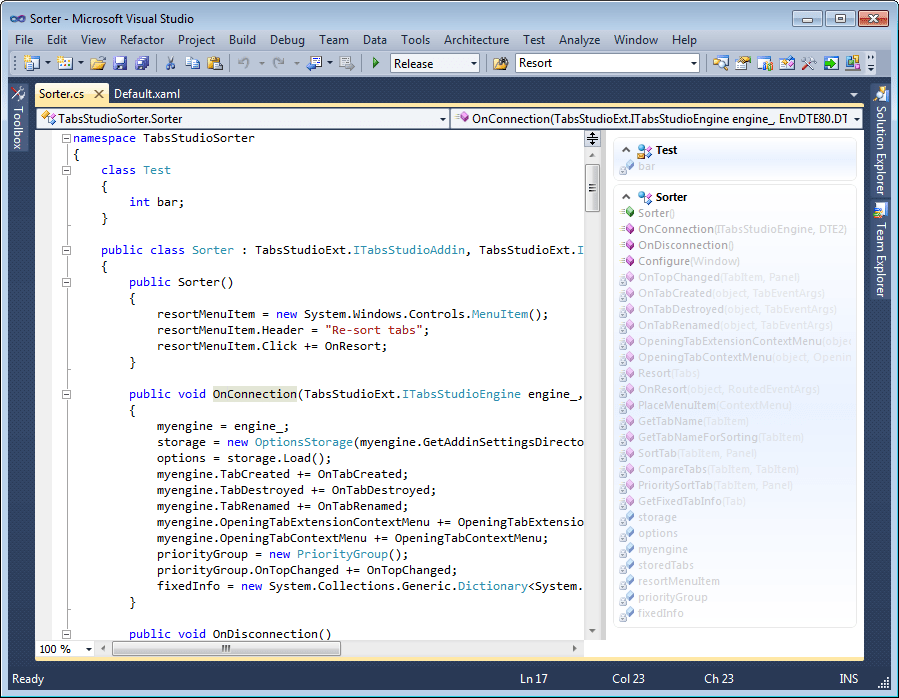
Code Jumper by Productive Joe streamlines navigation within a code file listing all methods and properties in a document to a side of the Visual Studio editor. You can navigate to any declaration with a single click in the list:

Code Jumper's navigation panel to the right of the open document in Visual Studio 2010

Code Jumper's navigation panel to the right of the open document in Visual Studio 2010


Clicking on a free space in the navigation panel opens a context menu to hide variables and properties, customize Code Jumper:
Options context menu

Options context menu


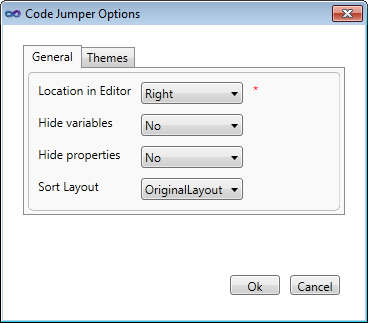
Code Jumper Options dialog

Code Jumper Options dialog

You can select navigation panel location to the right or to the left of the editor, default variables and properties visibility, alphabetical or original sorting (alphabetical sorting doesn’t currently work). You will need to reopen a document to apply new changes.

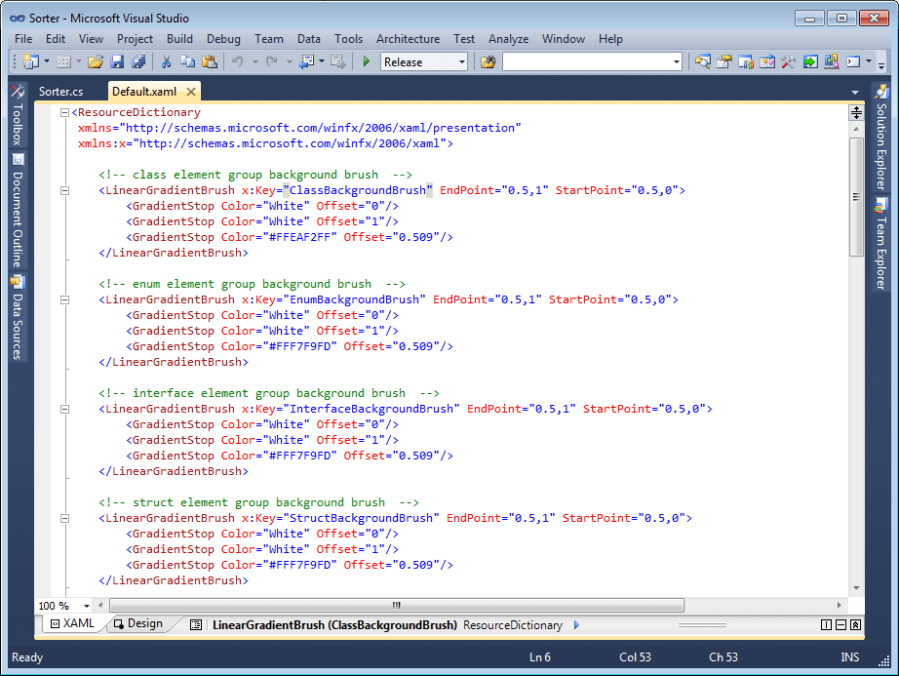
You can customize colors in Code Jumper’s navigation panel by editing WPF resources it uses. On the Themes tab click Edit Dafault.xaml, drag Default.xaml from the opened Explorer window to Visual Studio and modify any brush. Again, you will need to reopen a document to apply new colors:

Themes customization tab

Themes customization tab


Default.xaml customization in Visual Studio 2010 editor

Default.xaml customization in Visual Studio 2010 editor


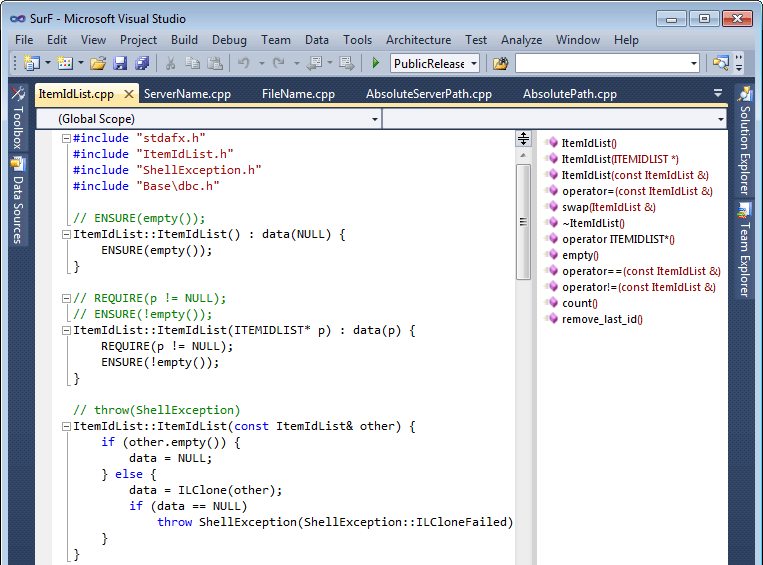
Code Jumper supports C++ and C++/CLI code and though I crashed it several times clicking on some declarations it generally works:
Code Jumper navigation for C++ code

Code Jumper navigation for C++ code


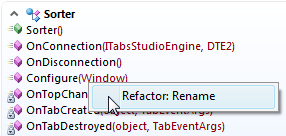
You can also quickly rename a method or a variable right clicking on a declaration in the navigation panel:
Rename context menu command

Rename context menu command


Code Jumper supports C#, Visual Basic, C++ in Visual Studio 2010. You can download this free extension from Visual Studio Gallery.


Organize Visual Studio tabs with Tabs Studio add-in

Posted in Reviews | Tagged , | Leave a comment

CodeFlow code review tool for Visual Studio

A new code review tool CodeFlow will ship in the next version of Visual Studio: The Story of CodeFlow.


Organize Visual Studio tabs with Tabs Studio add-in

Posted in Uncategorized | Tagged , | Leave a comment

PVS-Studio C++ static code analyzer tool for Visual Studio review

PVS-Studio by “Program Verification Systems” finds errors in your C++ code statically analyzing files in a Visual Studio solution.

Static analysis tools are a long term investment of time and money in code quality. They can find certain kinds of errors in your code, but in practice for C++ most of the time they just suggest suspicious code fragments for manual review. The balance between found errors and spurious warnings greatly depends on your own codebase. More fixed buffers, type casts and untyped functions like printf you use – more probably real errors will be found. Actually the only way to assess the usefulness of a static code analyzer for your project is to run it on your code. Reading others experiences (like John Carmack’s pursuit to static code analysis) can only prompt you to try it for yourself.

PVS-Studio can detect general C++ errors (storing a pointer to a local variable outside the scope of the variable, buffer overflow, semicolon after if/for/while), 64-bit portability errors (conversions between memsize and 32-bit types, alignment rule changes, deprecated Win64 system calls) and OpenMP errors (missing parallel/omp/for keywords, data races, throw in a parallel section). Overall more than 160 kinds of errors are detected.

You can manually start an analysis for a file, project or solution from the PVS-Studio menu in Visual Studio:
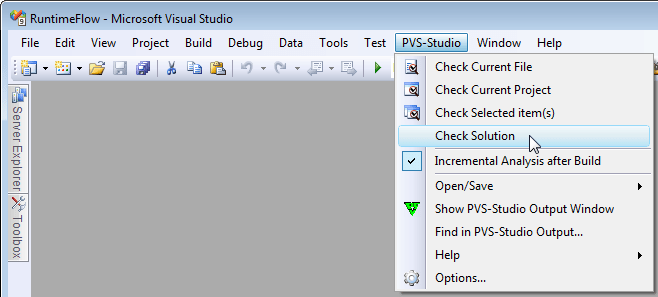
PVS-Studio menu in Visual Studio 2008

PVS-Studio menu in Visual Studio 2008

Found errors are displayed in the PVS-Studio analysis results tool window. You can see error description, jump to the code, sort and filter errors, mark an error as a false alarm:

PVS-Studio analysis results tool window in Visual Studio 2008

PVS-Studio analysis results tool window in Visual Studio 2008

PVS-Studio can automatically run the analysis on changed files after each build. PVS-Studio supports execution from command line and integration with TFS and other build automation systems like CruiseControl .NET and Hudson.

I’ve run PVS-Studio on my file manager. It is written mostly in high level C++ (Boost, standard C++ library, TBB) compiling cleanly with warning level 4 and with CLR extensions enabled. PVS-Studio doesn’t officially support C++/CLR, but seems to processed it successfully. The whole analysis took 8 hours on my quad core machine with Preprocessor set to VisualCPP and 3 processor’s cores used for analysis.

PVS-Studio warned me of identical sub-expressions to the left and to the right of the ‘!=’ operator in my unit tests when I test the overloaded ‘!=’ operator:

errors.assert(!(RelativePath(L"3") != RelativePath(L"3")), L"! 3 != 3");

Warned of empty exception handlers in code when I return false or empty boost::optional in case of an error:

try {
boost::wregex rx(mask, boost::regex::normal | boost::regbase::icase);
if (boost::regex_search(name, rx))
	return true;
} catch (const boost::bad_expression&) {
}
return false;

Warned of the .NET ‘list.Items’ pointer used simultaneously as an array and as a pointer to a single object in my unit tests:

WinForms::ListView list;
…
errors.assert_equals(3, list.Items->Count, L"items count with file");
if (list.Items->Count == 3){
	errors.assert_equals(
		DirectoryPresenter::current_directory_text(), cli_to_wstring(list.Items[1]->Text), L"item 1 with file");
	errors.assert_equals(
		std::wstring(L"1"), cli_to_wstring(list.Items[2]->Text), L"item 2 with file");
}

Warned of the identical conditional expressions of the ‘if’ operators situated alongside each other in my unit tests. In this case I agree the code can be changed to a single ‘if’ or to ‘mm.size() == 1’ in the first ‘if’:

void t_sliding_text_matches(TestErrors& errors)
{
	scalable_vector_path_match_characteristics mm = sliding_text_matches(L"cd_doc", L"cd_");
	errors.assert_equals(2u, mm.size(), L"sliding_text_matches: size");
	if (mm.size() == 2){
		PathMatchCharacteristics m = mm[0];
		…
	}
	if (mm.size() == 2){
		PathMatchCharacteristics m = mm[1];
		…
	}
}

Warned of the identical conditional expressions of the ‘if’ operators situated alongside each other in my DBC assertions:

RelativePath::RelativePath(const std::vector<FileName>& names) : names(names){
	REQUIRE(!names.empty());
	ENSURE(!names.empty());
}

Warned of the decreased performance when I missed to accept the ‘special_chars’ parameter by reference:

struct ExcludeSpecialChars : public boost::spirit::char_parser<ExcludeSpecialChars>
{
	typedef ExcludeSpecialChars self_t;
	ExcludeSpecialChars(const std::wstring special_chars) : special_chars(special_chars){
	}
	private:
		std::wstring special_chars;
};

I’ve also run PVS-Studio on a part of my .NET monitor. It again found 2 empty exception handlers. Warned of an odd explicit type casting that I used for direct access of object’s memory:

// REQUIRE(data.size() == sizeof(const void*));
std::wstring PrintString::print(const std::vector<unsigned char>& data) const
{
	const void* s = *reinterpret_cast<const void* const*>(&data[0]);
	if (s == NULL)
		return L"null";
…

As this project is ready for both 32-bit and 64-bit I turned on 64-bit checks and PVS-Studio warned me of several implicit conversions to memsize type in an arithmetic expression and of several magic numbers used. After a review I considered all these code fragments acceptable.

Overall, PVS-Studio showed it can check for non-trivial errors with not many false warnings (for example, Visual Studio code analysis gave me more than 200 warnings). The analysis process is very slow, but background incremental analysis only for changed files after each build alleviates this problem. Integration with Visual Studio works well and is very convenient.

A PVS-Studio license for 5 developers costs €3500 and not affordable to many developers. The freely available trial version hides line numbers for some errors it detects during the analysis, but the error messages and file names give enough context to locate the problematic code manually. A free license for 1 month is available for students, open source developers and bloggers.

PVS-Studio supports C/C++/C++11 applications developed in Visual Studio 2005/2008/2010. You can download the trial version from the official website.


Organize Visual Studio tabs with Tabs Studio add-in

Posted in Reviews | Tagged , , , | 2 Comments

BugAid tool for Visual Studio review

BugAid by Omer Raviv and Vitaly Belman helps you visualize, search and compare live objects data when debugging a C# application in Visual Studio 2008 and Visual Studio 2010.

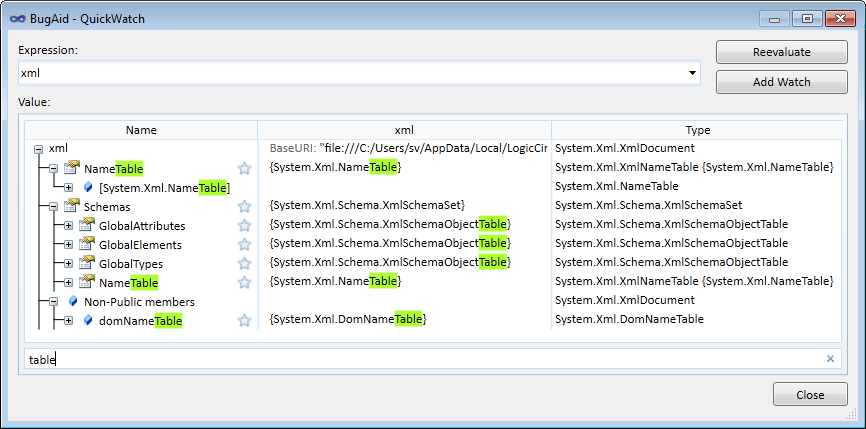
In the QuickWatch window or in a popup when you hover the mouse over a variable you can search for field names and data:

BugAid QuickWatch window

BugAid QuickWatch window


Popup BugAid object inspector in Visual Studio 2010

Popup BugAid object inspector in Visual Studio 2010


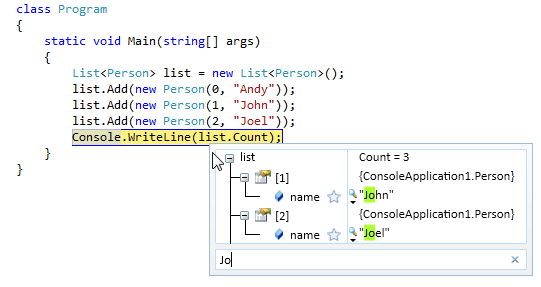
You can also search inside a collection:
Search in a collection

Search in a collection


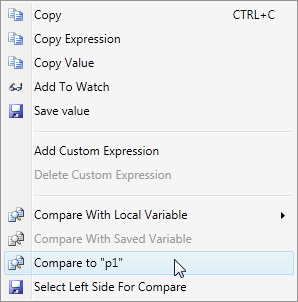
BugAid can compare two objects for you and find the differences:
Context menu commands for comparison

Context menu commands for comparison


Finding the differences in objects data

Finding the differences in objects data


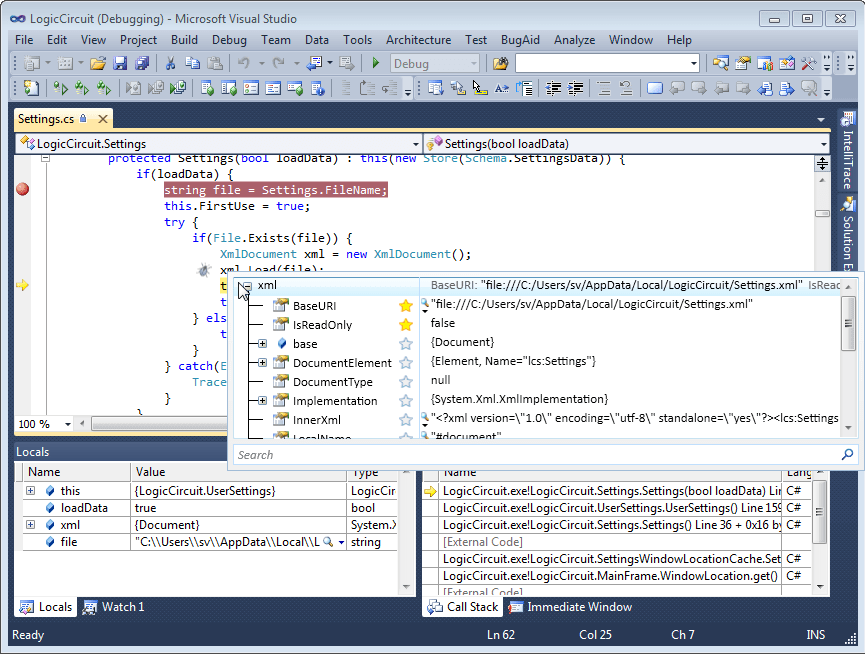
You can quickly customize the single line view for each class by selecting important fields that you want to see as a description. For example, in the following screenshot I selected the BaseURI and IsReadOnly properties for XmlDocument:
Customizing object description

Customizing object description


BugAid lets you add custom expressions written in C# that perform calculations on object’s data and call its methods (or call static methods on external classes). These results are shown along object’s properties:
Dynamically calculated expression Bugs fixed this month

Dynamically calculated expression Bugs fixed this month


Another interesting BugAid feature is the statement execution visualization. It shows parameters and return values of function calls happened when you Step Over a line in the debugger:
Statement execution visualization

Statement execution visualization

BugAid supports debugging of C# applications in Visual Studio 2008 and Visual Studio 2010. A personal license costs $49. A 60-day trial version can be downloaded from the official website.


Organize Visual Studio tabs with Tabs Studio add-in

Posted in Reviews | Tagged , , | 1 Comment

Inheritance Margin extension for Visual Studio 2010 review

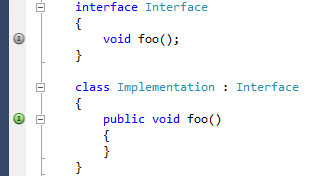
Inheritance Margin by Sam Harwell adds special glyphs to virtual methods and properties in the Visual Studio 2010 editor. For interface methods it adds the I glyph and for virtual methods it adds the O glyph:
I glyphs for the interface method

I glyphs for the interface method


O glyphs for the virtual method

O glyphs for the virtual method


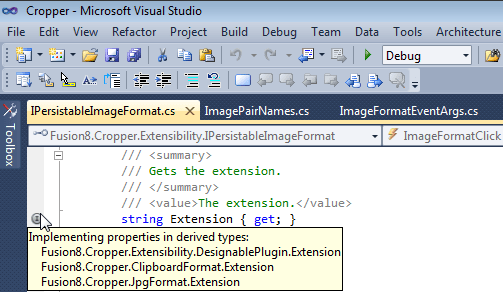
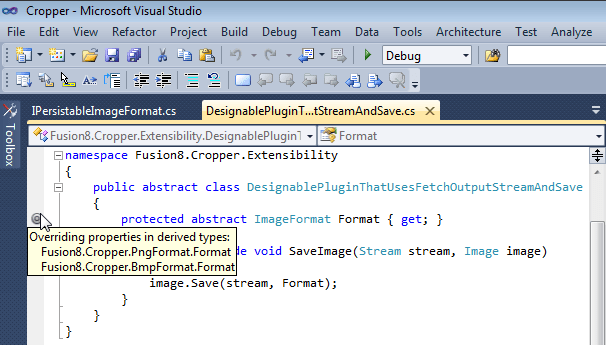
When you hover the mouse over a base glyph it displays what types implement or override this method or property:
Implementing properties tooltip

Implementing properties tooltip


Overriding properties tooltip

Overriding properties tooltip


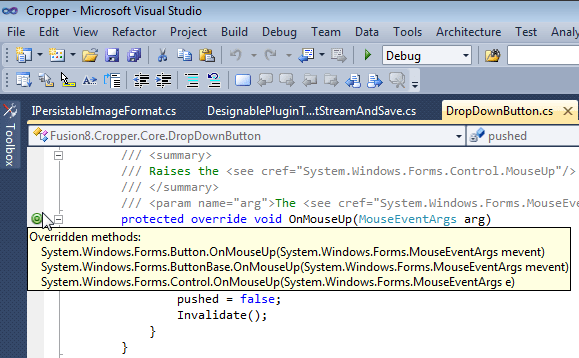
When you hover the mouse over a derived glyph it displays all base methods that are overridden:
Overridden methods tooltip

Overridden methods tooltip


Inheritance Margin currently supports only C# and Visual Studio 2010. You can download this free extension from Visual Studio Gallery.


Organize Visual Studio tabs with Tabs Studio add-in

Posted in Reviews | Tagged , | Leave a comment

Tabs Studio v2.6.0 released

Tabs Studio is a Visual Studio add-in empowering you to work comfortably with any number of open documents.

See what’s new in v2.6.0.

Download the installer.

Posted in Vlasov Studio tools | Tagged , , , | Leave a comment

Text Sharp and Favorite Documents support for Visual Studio 11

If you run Visual Studio 11 Developer Preview, you can now install the Text Sharp and Favorite Documents extensions for it as I’ve updated them to support both Visual Studio 2010 and Visual Studio 11.

BTW, Tabs Studio also supports Visual Studio 11 Developer Preview.

Posted in Vlasov Studio tools | Tagged , , | Leave a comment