
Last week, in a Visual Studio Toolbox episode on Channel 9, Omer Raviv highlighted most useful features of the OzCode C# debugging extension for Visual Studio and announced upcoming version 4 introducing a live debugger accessible from a web browser.
With OzCode you can quickly search member names and values in collections and complex objects during debugging:

LINQ debugging and analysis visualizes how the different items passed through the LINQ pipeline. Indicators show you at-a-glance how many items were consumed by each LINQ operator, and how many were produced. The LINQ DataTip window shows the items the given operator produced:
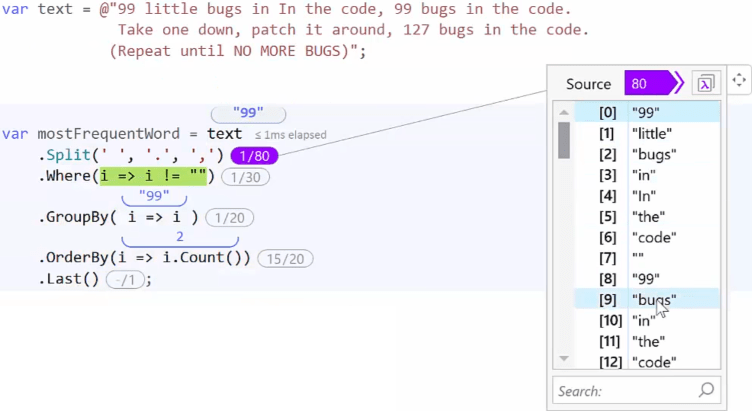
The detailed analysis tool window lets you navigate between the LINQ pipeline using the operator breadcrumbs and take advantage of the animation to visualize the flow of the LINQ query:

A new feature coming to v4 of the extension is live coding. It compiles and run code in background as you type and shows calculated variable values in line with code:
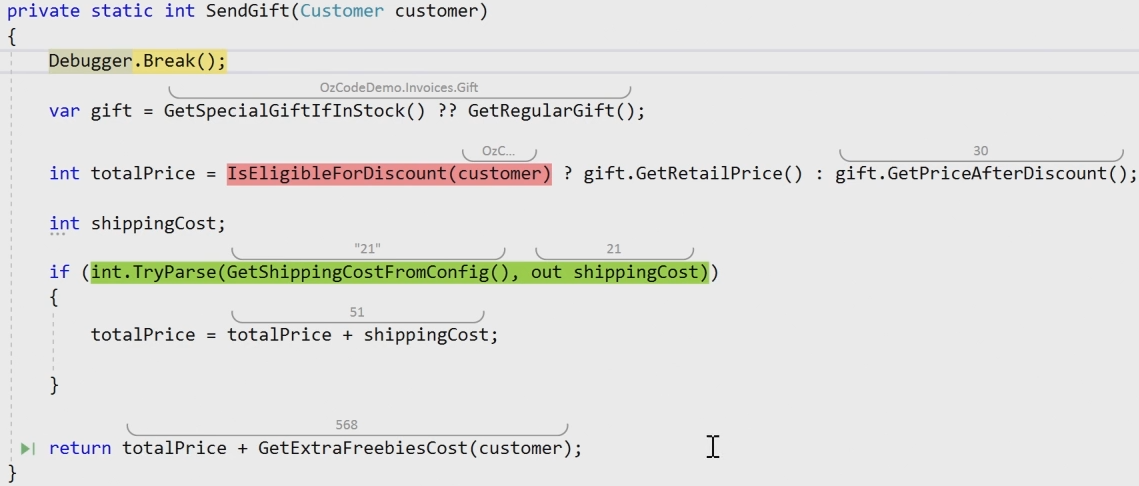
It predicts code execution, unlike classical historical debugging, and lets you change it on the fly. Any code changes in the editor are immediately reapplied after typing and update calculated values, all within a single debugging session. When code with side effects is detected – execution stops.
[As a side note, live coding in Visual Studio was first implemented in 2015 by Josh Varty and Amadeus Wieczorek as the Alive extension. You can see it in action in a Codemash 2016 episode on Channel 9:

It worked in normal coding mode, not during debugging, and allowed to enter values for function parameters or extract them from unit tests. Later in 2016 the developers joined Microsoft and the extension was unfortunately discontinued. Then VS 2017 introduced Live Unit Testing which provides real-time feedback directly in the editor on how code changes are impacting your unit tests and your code coverage.]
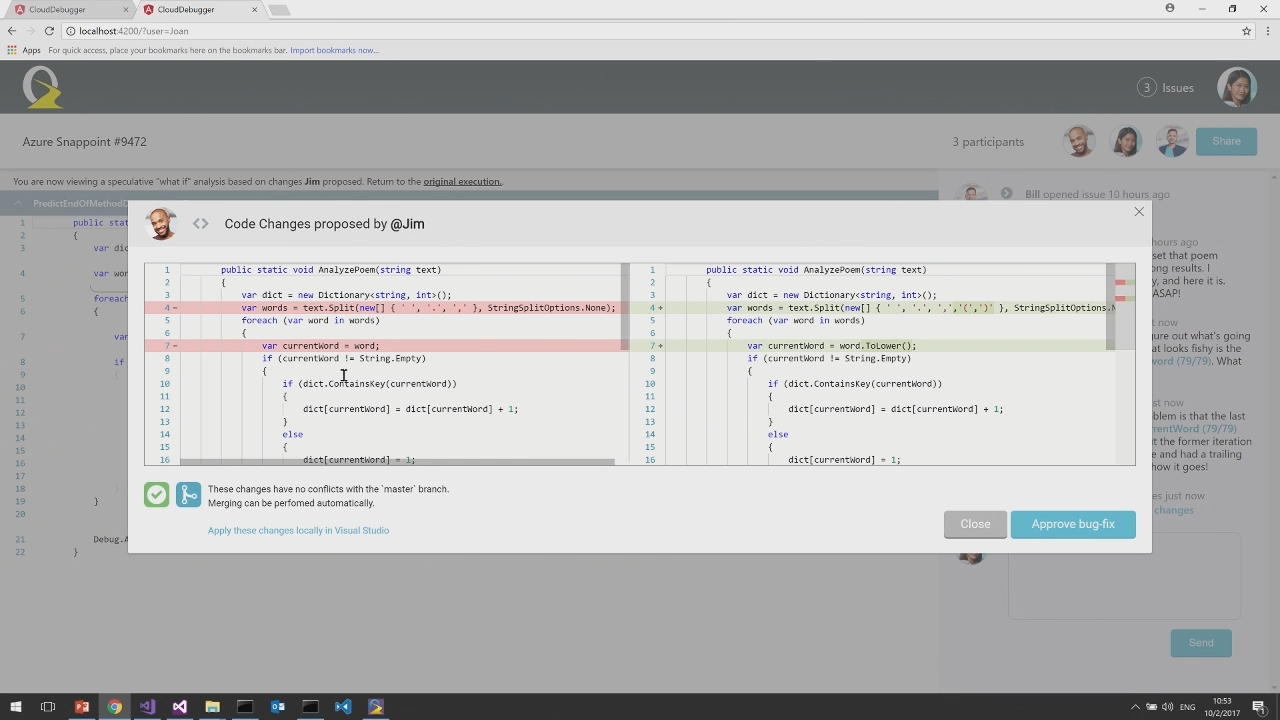
Another upcoming OzCode v4 feature is collaborative debugging. It will allow you to share your current debug session with other people, not even necessarily having Visual Studio installed, using OzCode cloud debugger. Your colleagues will be able to interact with code from a web browser – view an actual execution that was captured and change the code to experiment:

OzCode version control system integration allows proposing and approving final code changes also from the same browser window:
See the full episode for more details. A personal OzCode license for 1 year currently costs $100.

